A fair start to 2021

Share
Global markets got off to a steady start in 2021 after the volatility of 2020.
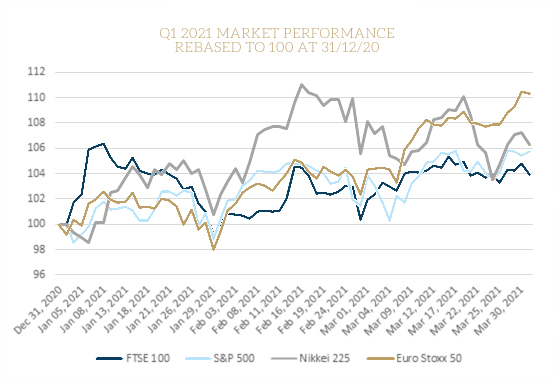
After an interesting first quarter in 2020, one year on markets have had a much quieter first three months in 2021, as the graph above shows. The UK, as measured by the FTSE 100 appears to remain a laggard, but that ignores the recent strength of sterling. Allow for that and the 3.9% rise in the FTSE 100 is better than the MSCI All-World performance of 3.2% in sterling terms. Similarly, the standout 10.3% rise of the Euro Stoxx 50 on the graph drops to just 2.1% when adjusted for the change in £/€ exchange rate.
A summary of the movements in the main markets is shown below:
| 31/12/2020 | 31/03/2021 | Change in Q1 2021 | |
| FTSE 100 | 6460.52 | 6713.63 | 3.92% |
| FTSE 250 | 20488.3 | 21518.71 | 5.03% |
| FTSE 350 Higher Yield | 2893.08 | 3106.46 | 7.38% |
| FTSE 350 Lower Yield | 4291.83 | 4335.49 | 1.02% |
| FTSE All-Share | 3673.63 | 3831.05 | 4.29% |
| S&P 500 | 3756.07 | 3972.89 | 5.77% |
| Euro Stoxx 50 (€) | 3552.64 | 3919.21 | 10.32% |
| Nikkei 225 | 27444.17 | 29178.8 | 6.32% |
| Shanghai Composite | 3473.07 | 3441.91 | -0.90% |
| MSCI Em Markets (£) | 1767.417 | 1785.206 | 1.01% |
| UK Bank base rate | 0.10% | 0.10% | |
| US Fed funds rate | 0.00%-0.25% | 0.00%-0.25% | |
| ECB base rate | 0.00% | 0.00% | |
| 2 yr UK Gilt yield | -0.17% | 0.10% | |
| 10 yr UK Gilt yield | 0.19% | 0.85% | |
| 2 yr US T-bond yield | 0.12% | 0.16% | |
| 10 yr US T-bond yield | 0.92% | 1.75% | |
| 2 yr German Bund Yield | -0.71% | -0.70% | |
| 10 yr German Bund Yield | -0.57% | -0.30% | |
| £/$ | 1.3669 | 1.3797 | 0.94% |
| £/€ | 1.1172 | 1.1739 | 5.08% |
| £/¥ | 141.1299 | 152.4559 | 8.03% |
A few points are worth noting from this table:
The out-performance of the FTSE 350 Higher Yield over its Lower Yield counterpart is a reflection of the trend towards value. It is mirrored in the USA where the more heavily tech-weighted S&P 500 underperformed the Dow Jones Industrial Index by 2%.
Emerging markets were relatively disappointing in Q1, dragged down by China and rising US bond yields.
Increasing bond yields were a notable feature of the quarter. Although base rates were unmoved and 2-year Government bond yields little changed, 10-year yields rose sharply. There is now talk of the 2% barrier being breached for 10-year US Treasuries before the end of the year – more than double the starting level.
While the first quarter had its fair share of ups and downs, as the graph shows, the rise was more of a churn upwards than a straight trend. How long markets can continue to rise if bond rates continue to do the same is the point to watch in the coming three months.
Articles on this website are offered only for general information and educational purposes. They are not offered as, and do not constitute, financial advice. You should not act or rely on any information contained in this website without first seeking advice from a professional.
Past performance is not a guide to future performance and may not be repeated. Capital is at risk; investments and the income from them can fall as well as rise and investors may not get back the amounts originally invested.
![]() You are now departing from the regulatory site of Finura. Finura is not responsible for the accuracy of the information contained within the linked site.
You are now departing from the regulatory site of Finura. Finura is not responsible for the accuracy of the information contained within the linked site.
Source: Techlink
Share
Other News
Finura in the Spotlight: Shortlisted for Multiple Awards
Finura has an exciting few months ahead, as we wait to see the outcome of a number of short listings in different awards categories. MONEY MARKETING AWARDS – Advice firm of the year The winners will be announced on 12 September 2024 at The Londoner Hotel in London https://moneymarketingawards.co.uk/2024/en/page/shortlist-2024#adviser MONEYAGE AWARDS – Financial Adviser Award: […]
5 Tips For Parents With Children Heading To University
Starting university can be a challenging transition, but with a few lifestyle changes and careful planning, it can be a much smoother and enjoyable experience.
Empowering Yourself For Your Future: The Importance Of Lasting Powers Of Attorney (Property And Financial Affairs)
Life is unpredictable and unforeseen circumstances can sometimes leave us incapable of making decisions about our own affairs. That’s where a Property and Financial Affairs Lasting Power of Attorney (LPA) comes into play.